5.0 Insights
See what merged, how fast, and at what cost.
One dashboard for all the work: what merged, how long it took, where it waits and how often a person had to step in. Rules watch the numbers and raise a flag, and every change to your process is marked on the charts.
5.1 Dashboard
Six views of the same work
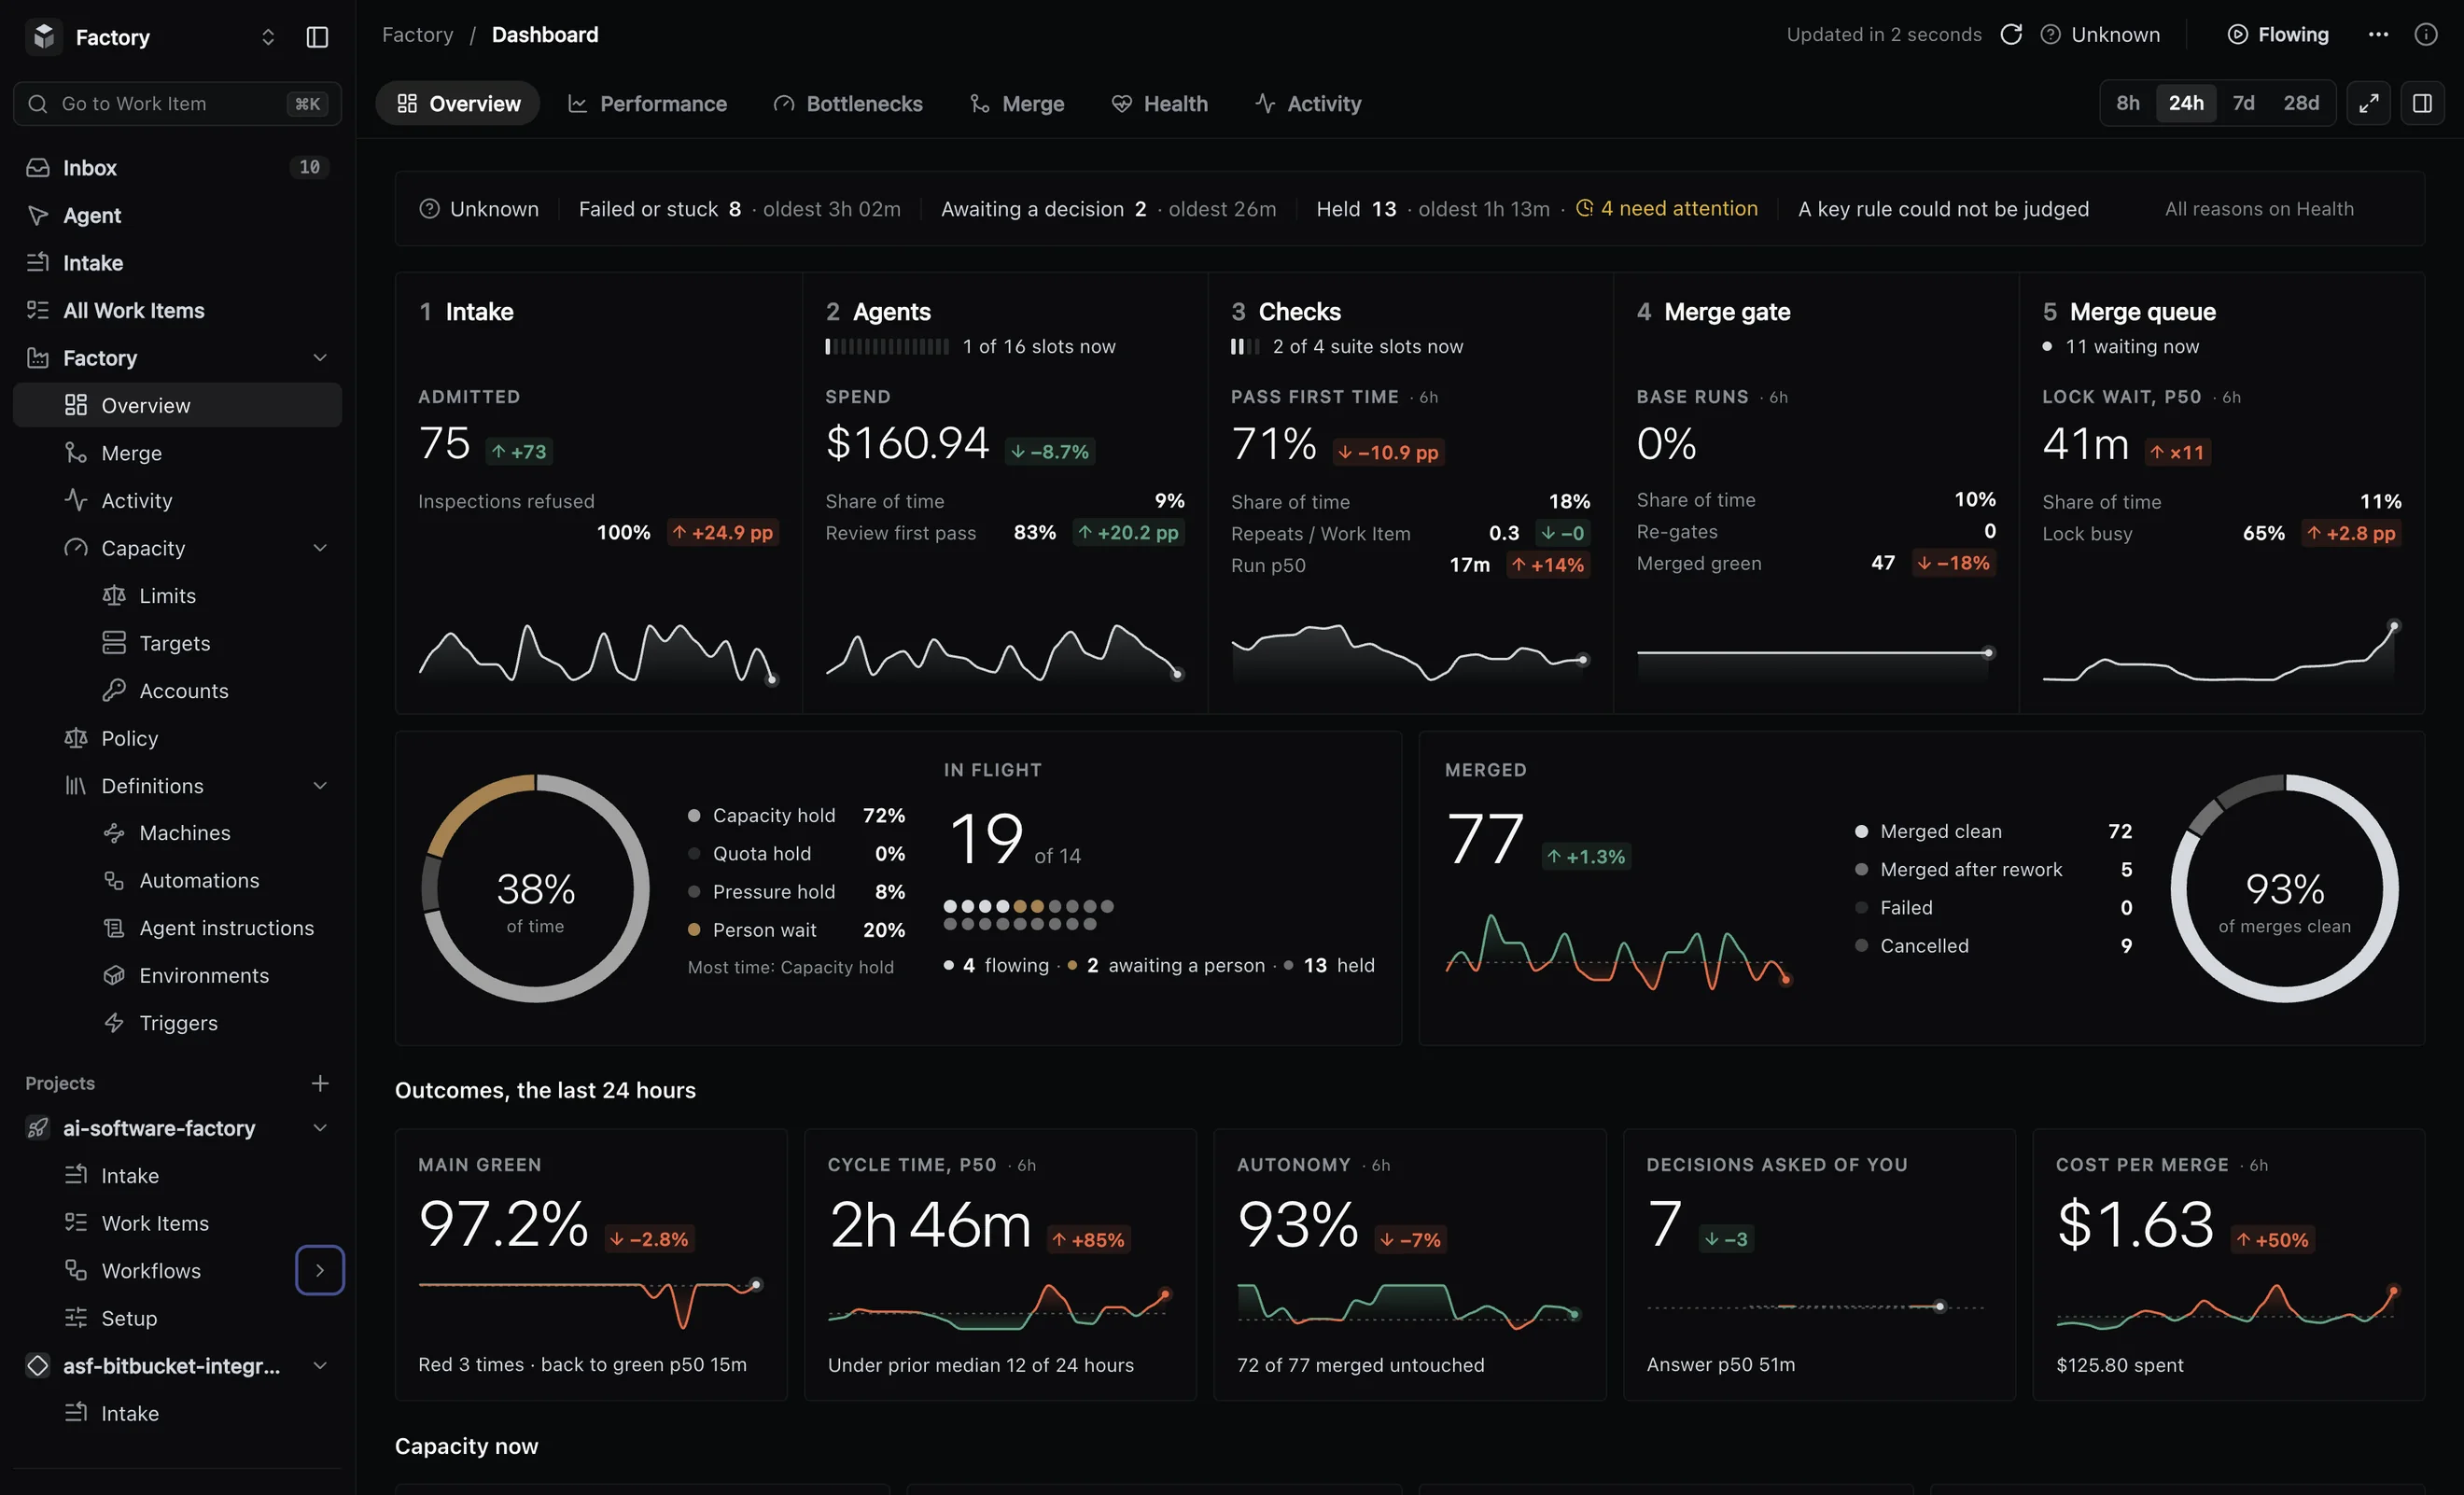
Start with Overview for what is happening now, then go deeper. Each view answers one question, from what is moving this minute to what changed in your process last week.
Overview
Health, and the work in flight by stage: intake, agents, checks, merge gate and merge queue.
Performance
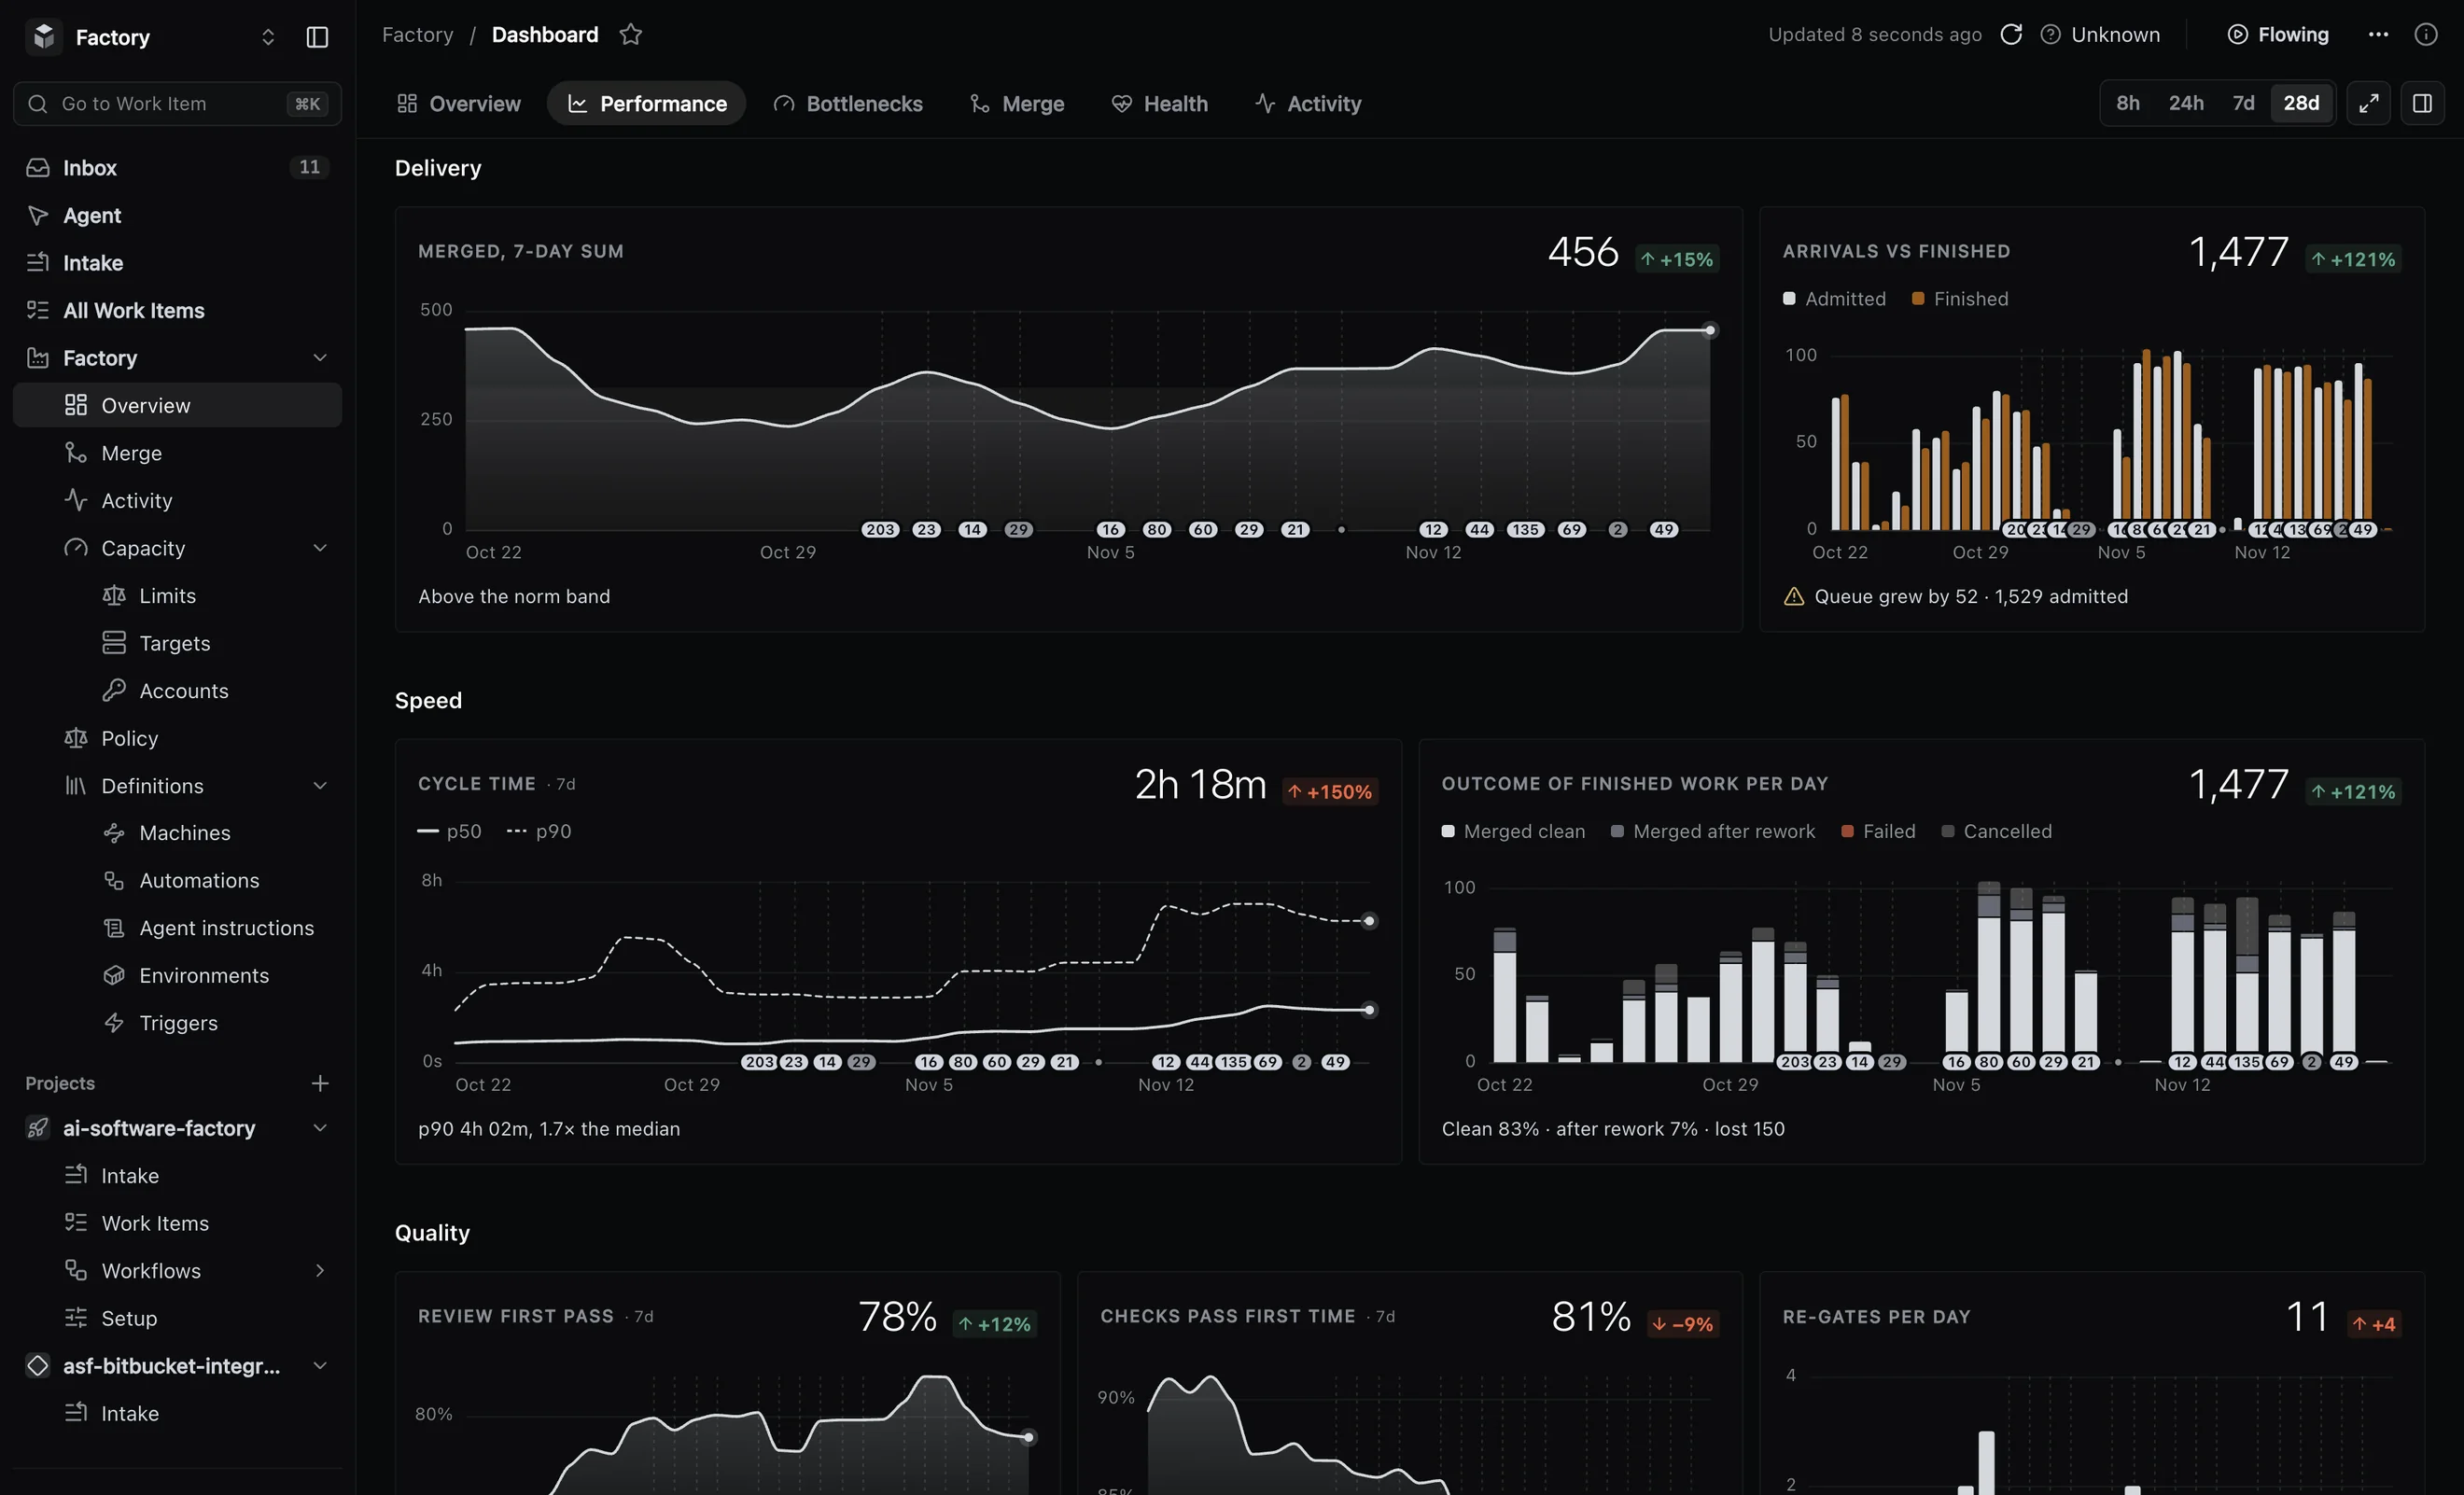
Merged against your goal, cycle time at p50 and p90, review and checks passed first time.
Bottlenecks
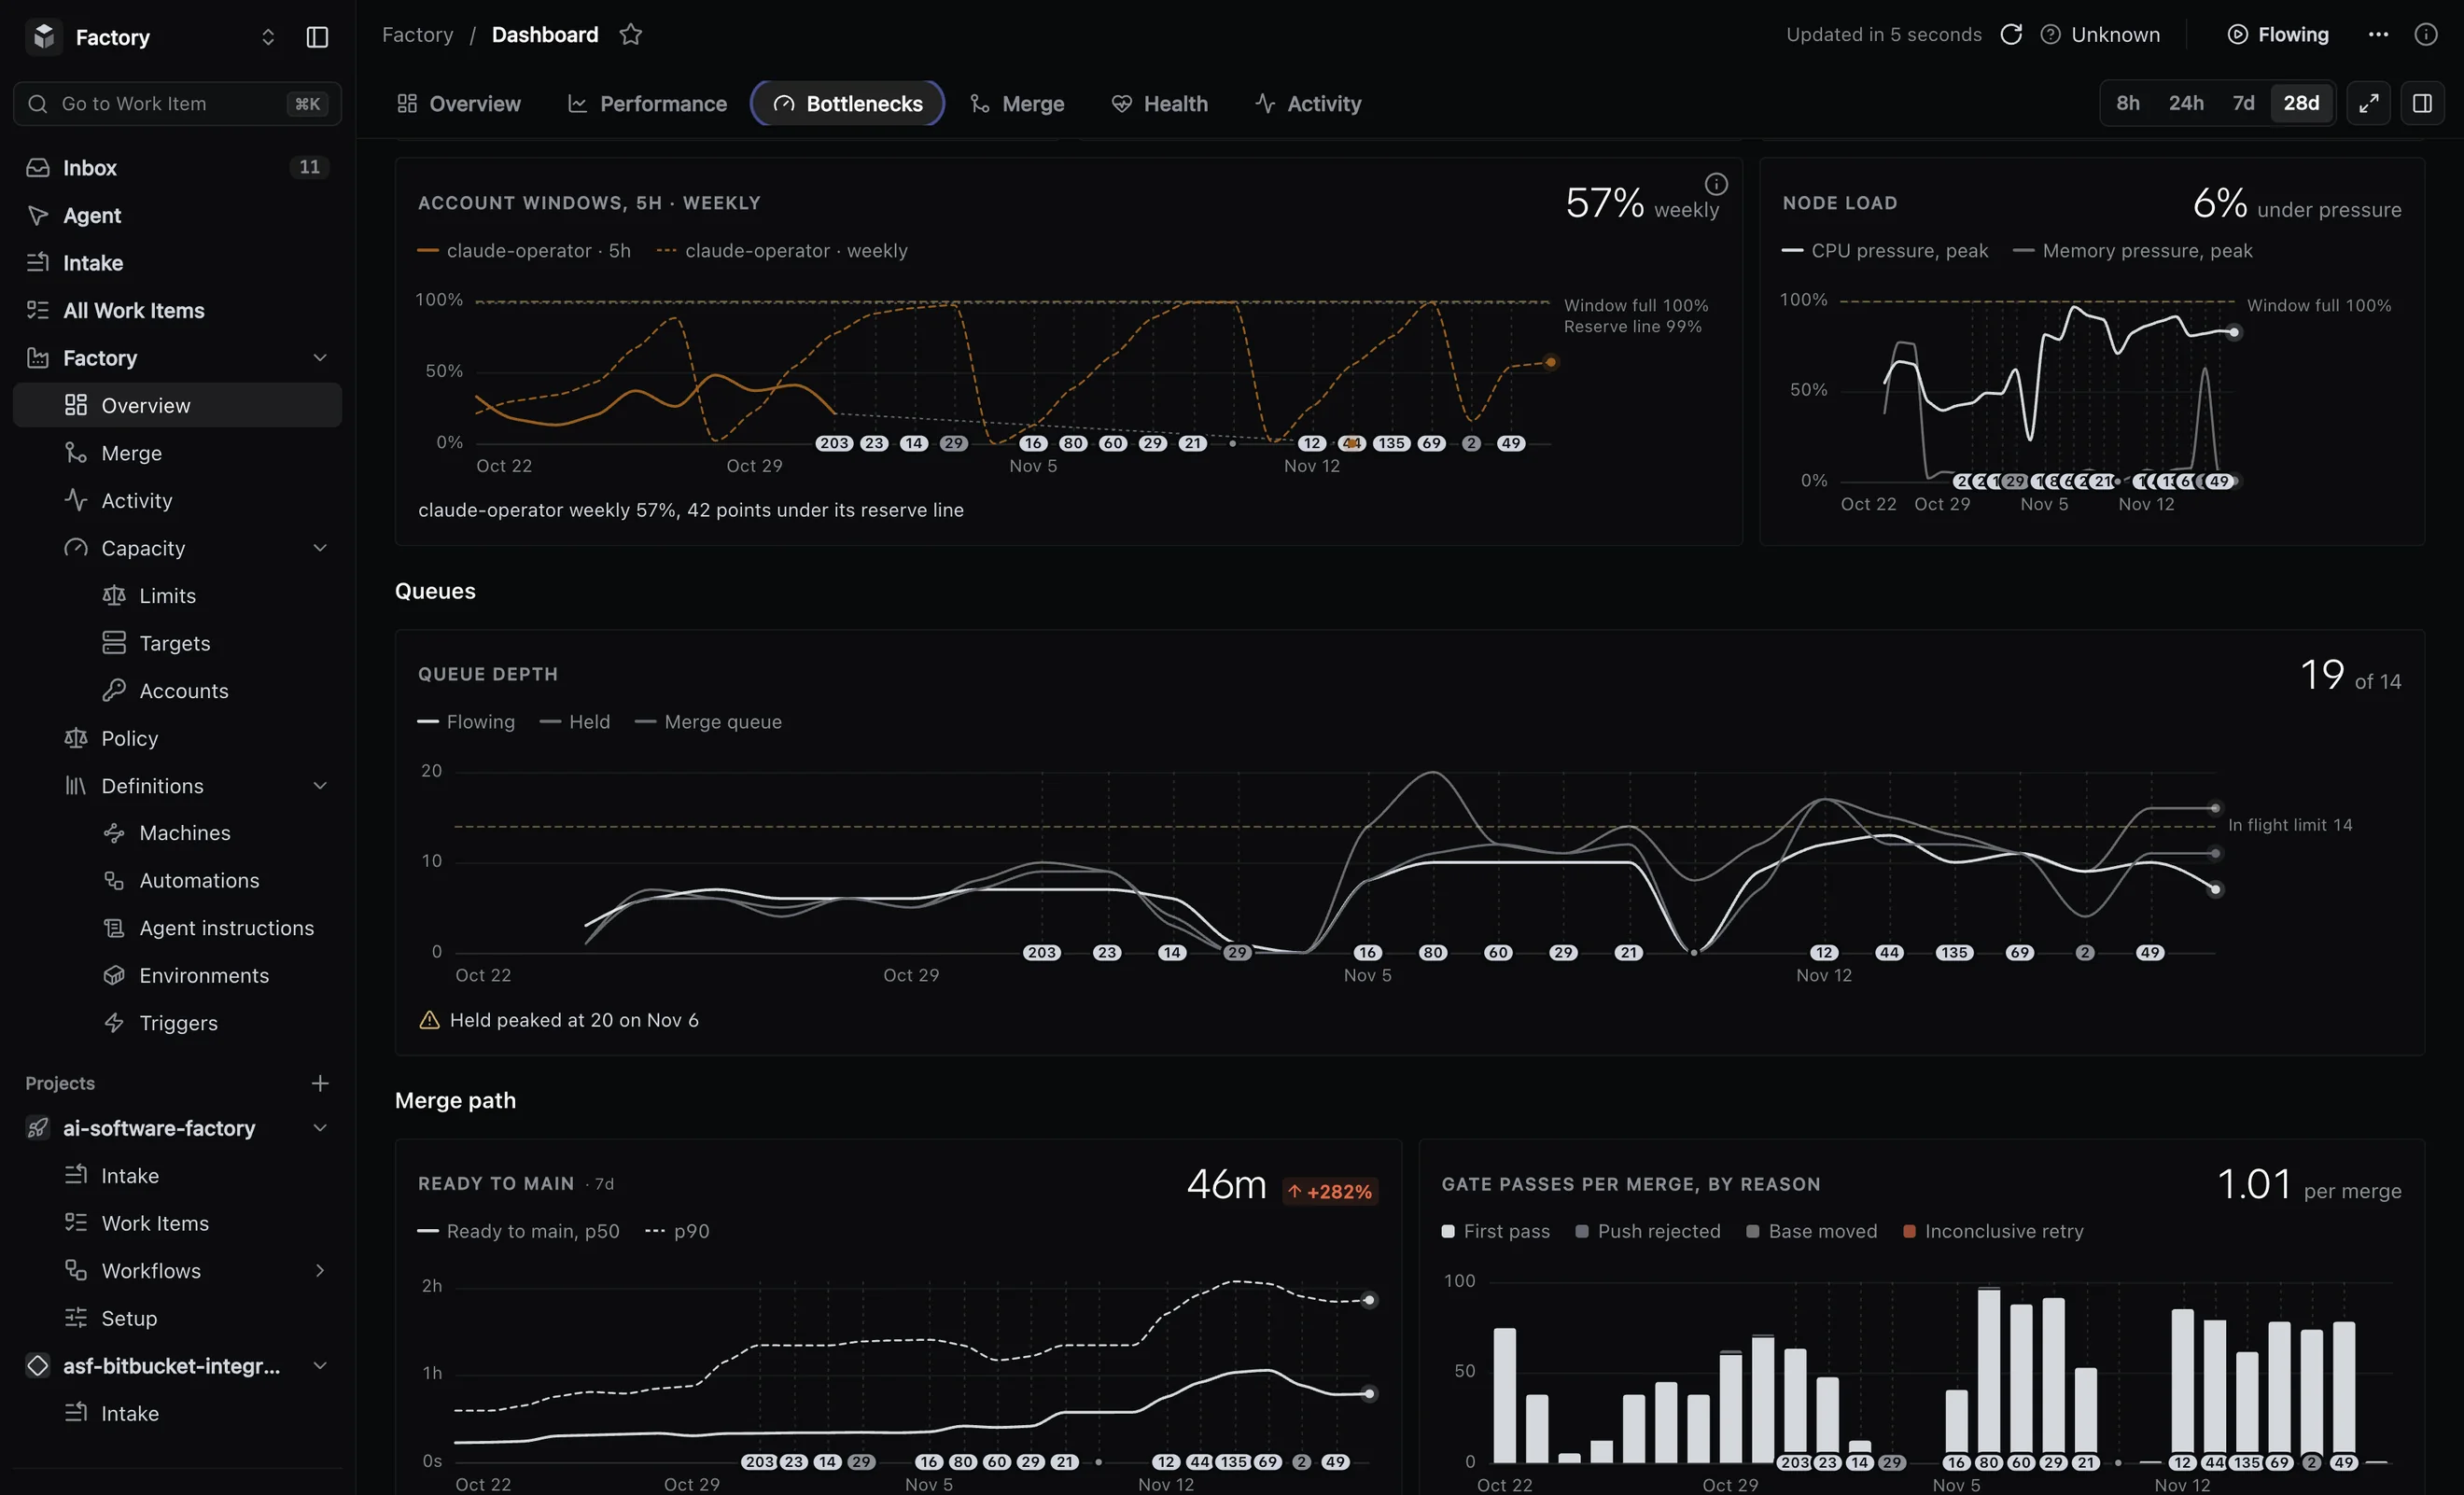
Where the time goes, so you know what to fix first.
Merge
How changes get through the merge gate and the queue into main.
Health
Which rules fired, how fresh each source is, and main over time.
Activity
What changed in your process and when, next to the numbers.
5.2 Measures
Speed, quality and cost of every change
The delivery numbers your team already knows, plus the two that agents add: what each merged change cost and how often a person was asked.
- Changes merged per week
- Merged against the goal
- Cycle time, p50 and p90
- Where time goes
- Review passed first time
- Checks passed first time
- Main branch green
- Outcome of finished work
- Cost per merged change
- Decisions asked of people
- Arrivals and completions
- Age of open work
5.3 Signals
When a number drifts, you hear about it
About 20 rules watch the numbers, each with a threshold you set. When one fires, a flag lands in one Attention inbox: the build on main broke, work has waited too long for a person, throughput dropped, cost drifted, a test file got noisy, a source went silent.
5.4 Feedback loops
Problems become work, not noise
What goes wrong, or turns up along the way, comes back to the same queue as new work. Agents file what they find outside their task as separate work, and review remarks that do not block become follow-up work. A broken build on main becomes repair work and an alert becomes an investigation. The factory also files its own incidents and alerts you.
5.5 Process changes
Every process change, on the charts
Each new version of a workflow or of a project’s rules is marked on the charts. You read the numbers on either side of the mark and decide whether the change helped. The factory shows the evidence; a person makes the call.
Marked on the charts
Each change shows on the Performance charts at the moment it went live.
Listed in Activity
Every change with its version and the note written with it.
One step back
If it did not help, activate the previous version. Work in flight stays on the version it started with.